(Wahltag: 28. 04. 1946)
| Ergebnisse der 18 Landkreise, der 3 kreisfreien Städt (Wahltag: 28. 04. 1946) |
||
|
||
| Die Bezirke von Baden | ||||||
| Konstanz | Freiburg | Baden-Baden | ||||
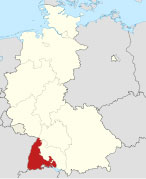
| Ergebnisse der 9 Landkreise und 1 kreisfreien Stadt im Bezirk Freiburg (Wahltag: 28. 04. 1946) |
||
| Stadtkreis Freiburg | Gemeindewahl 28. April 1946 | |||
| Stimmberechtigte | 58.728 | |||
| Wahlbeteiligung | 67,8 % | |||
| Sitze | 36 | |||
| Stimmberechtigte/Sitz | 1.631 | |||
| Partei | Prozent | Sitze | |
| Badische Christlich-Soziale Volkspartei | 52,1 % | 22 | |
| Sozialdemokratische Partei | 21,6 % | 7 | |
| Demokratische Partei | 17,2 % | 5 | |
| Kommunistische Partei | 9,1 % | 2 | |
| Landkreis Emmendingen | Kreiswahl 28. April 1946 | |||
| Stimmberechtigte | 44.594 | |||
| Wahlbeteiligung | 68,6 % | |||
| Sitze | 24 | |||
| Stimmberechtigte/Sitz | 1.858 | |||
| Partei | Prozent | Sitze | |
| Badische Christlich-Soziale Volkspartei | 62,2 % | 16 | |
| Sozialdemokratische Partei | 23,2 % | 5 | |
| Demokratische Partei | 9,0 % | 2 | |
| Kommunistische Partei | 5,6 % | 1 | |
| Landkreis Freiburg | Kreiswahl 28. April 1946 | |||
| Stimmberechtigte | 31.175 | |||
| Wahlbeteiligung | 61,7 % | |||
| Sitze | — | |||
| Stimmberechtigte/Sitz | — | |||
| Partei | Prozent | Sitze | |
| Badische Christlich-Soziale Volkspartei | 74,1 % | — | |
| Sozialdemokratische Partei | 11,9 % | — | |
| Demokratische Partei | 10,4 % | — | |
| Kommunistische Partei | 3,6 % | — | |
| Landkreis Kehl | Kreiswahl 28. April 1946 | |||
| Stimmberechtigte | 23.618 | |||
| Wahlbeteiligung | 63,9 % | |||
| Sitze | 18 | |||
| Stimmberechtigte/Sitz | 1.312 | |||
| Partei | Prozent | Sitze | |
| Badische Christlich-Soziale Volkspartei | 41,5 % | 8 | |
| Demokratische Partei | 27,6 % | 5 | |
| Sozialdemokratische Partei | 21,7 % | 4 | |
| Kommunistische Partei | 9,2 % | 1 | |
| Landkreis Lahr | Kreiswahl 28. April 1946 | |||
| Stimmberechtigte | 36.949 | |||
| Wahlbeteiligung | 73,2 % | |||
| Sitze | 22 | |||
| Stimmberechtigte/Sitz | 1.680 | |||
| Partei | Prozent | Sitze | |
| Badische Christlich-Soziale Volkspartei | 55,9 % | 13 | |
| Demokratische Partei | 21,6 % | 5 | |
| Sozialdemokratische Partei | 15,3 % | 3 | |
| Kommunistische Partei | 7,2 % | 1 | |
| Landkreis Lörrach | Kreiswahl 28. April 1946 | |||
| Stimmberechtigte | 52.003 | |||
| Wahlbeteiligung | 66,7 % | |||
| Sitze | 28 | |||
| Stimmberechtigte/Sitz | 1.857 | |||
| Partei | Prozent | Sitze | |
| Badische Christlich-Soziale Volkspartei | 40,2 % | 12 | |
| Sozialdemokratische Partei | 26,0 % | 7 | |
| Demokratische Partei | 21,0 % | 6 | |
| Kommunistische Partei | 12,8 % | 3 | |
| Landkreis Müllheim | Kreiswahl 28. April 1946 | |||
| Stimmberechtigte | 22.061 | |||
| Wahlbeteiligung | 56,7 % | |||
| Sitze | 18 | |||
| Stimmberechtigte/Sitz | 1.226 | |||
| Partei | Prozent | Sitze | |
| Badische Christlich-Soziale Volkspartei | 56,3 % | 11 | |
| Demokratische Partei | 19,2 % | 3 | |
| Sozialdemokratische Partei | 18,6 % | 3 | |
| Kommunistische Partei | 5,9 % | 1 | |
| Landkreis Neustadt im Schwarzwald | Kreiswahl 28. April 1946 | |||
| Stimmberechtigte | 19.267 | |||
| Wahlbeteiligung | 76,7 % | |||
| Sitze | 18 | |||
| Stimmberechtigte/Sitz | 1.070 | |||
| Partei | Prozent | Sitze | |
| Badische Christlich-Soziale Volkspartei | 66,1 % | 13 | |
| Sozialdemokratische Partei | 14,5 % | 2 | |
| Demokratische Partei | 14,2 % | 2 | |
| Kommunistische Partei | 5,2 % | 1 | |
| Landkreis Offenburg | Kreiswahl 28. April 1946 | |||
| Stimmberechtigte | 42.288 | |||
| Wahlbeteiligung | 69,9 % | |||
| Sitze | 24 | |||
| Stimmberechtigte/Sitz | 1.762 | |||
| Partei | Prozent | Sitze | |
| Badische Christlich-Soziale Volkspartei | 68,8 % | 17 | |
| Sozialdemokratische Partei | 12,3 % | 3 | |
| Demokratische Partei | 11,6 % | 3 | |
| Kommunistische Partei | 7,3 % | 1 | |
| Landkreis Wolfach | Kreiswahl 28. April 1946 | |||
| Stimmberechtigte | 23.414 | |||
| Wahlbeteiligung | 74,1 % | |||
| Sitze | 18 | |||
| Stimmberechtigte/Sitz | 1.301 | |||
| Partei | Prozent | Sitze | |
| Badische Christlich-Soziale Volkspartei | 62,8 % | 12 | |
| Sozialdemokratische Partei | 23,1 % | 4 | |
| Demokratische Partei | 8,6 % | 1 | |
| Kommunistische Partei | 5,5 % | 1 | |